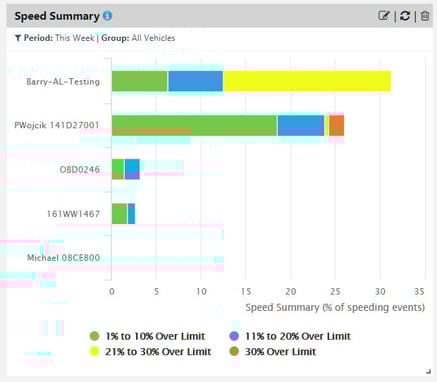
The default is to show all ranges of data in a graph, but data can be hidden if required. An example of this can be seen in the Speed Summary, which includes four ranges of data.
To hide a data range in the graphic, click on the relevant legend.
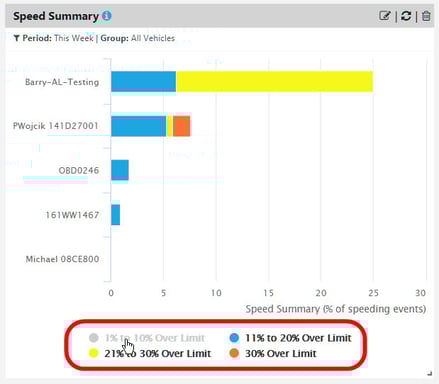
Click on the legend again to add the data back into the graph.