-
Speed Improvement
This report shows how much drivers have reduced (improved) or increased (worsened) their speeding over a selected time period.
To open the report:
- Click on the Services menu in the menu header
- Click on Speed Improvement under ‘Driving Style’ in the drop-down menu.

Here is an example of a Speed Improvement report from our demonstration account for the 'Last 6 Months' and we will explain how you can understand the data below.


- Vehicles showing reduced speeding events are depicted in green and those showing increased speeding events are in red.
-
The information contained in this report covers the following for speed improvement during the selected period:
- Vehicle
- Speeding events for each week/month
- Average number over the period
- Improvement percentage – positive number (more speeding events) or negative number (less speeding events)
-
Understanding the data
The source of the data for the Speed Improvement report is the speeding data from the Speed Summary.The Speed Improvement report above is for the last 6 full months and shows the percentage of speeding for each month.Let's use the example of the vehicle with the description 'Renault Traffic'.
We use the speeding data from the Speed Summary for the first 5 months for this vehicle.
We calculate an average from the first 5 months to produce 3.49%
We use the benchmark of the 6th month (in this example September) of 4.89% to identify an increase or decrease.
The formula we use in this case is (4.89/3.49)*100)-100) to produce 40.11%. The speeding has worsened by 40.11%compared to the benchmark of September. -
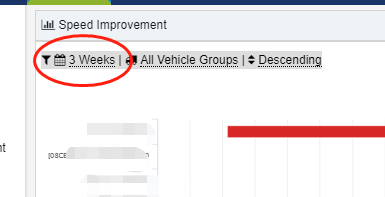
Change the date range
- Click on the date range or calendar icon.
-
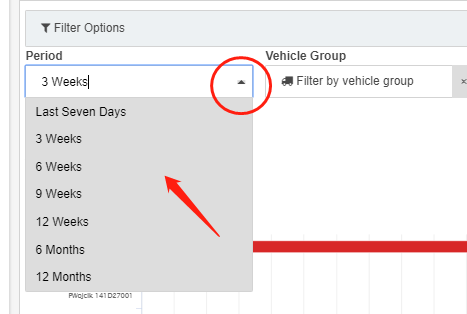
The filter options panel will open.
- Click on the required date period from the drop-down menu.
- Click on Apply Filter.
The table and chart will reload with data from the selected date period.
-
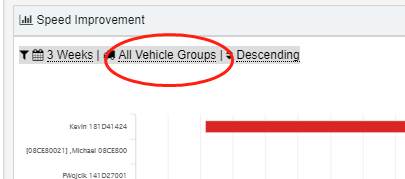
Filter by vehicle group
The default is to show all vehicle groups, but you can filter the results to show only one group.
- Click on All Vehicle Groups above the chart.
-
The filter option panel will open.
- Click on the required group from the drop-down list.
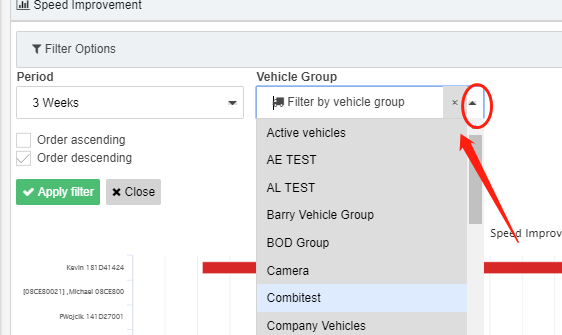
- Click on Apply Filter.
The chart and report will automatically filter to just show the selected vehicle group.
- If you wish to remove the group from the filter so all vehicles or drivers will be included, click on the small x next to the drop-down arrow.
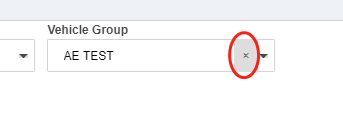
- Click on Apply Filter.
-
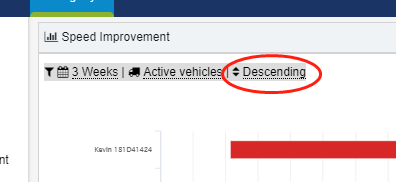
Re-order the results
- Click on Desending above the chart.
-
The filter option panel will open.
-
Click on either Order ascending or Order decending.
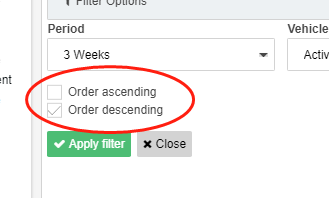
- Click on Apply Filter.
-
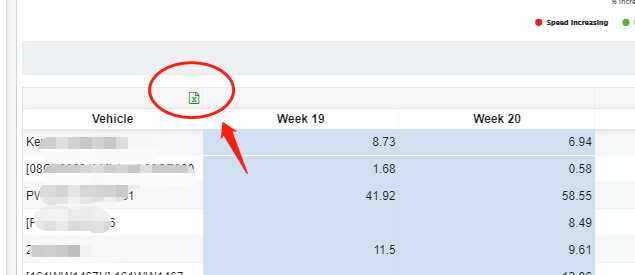
Export speed trend data
- To download the data as a CSV file, click on the Export icon above the table.
- Navigate to where on your system you want to save the file.
- Click on Save.
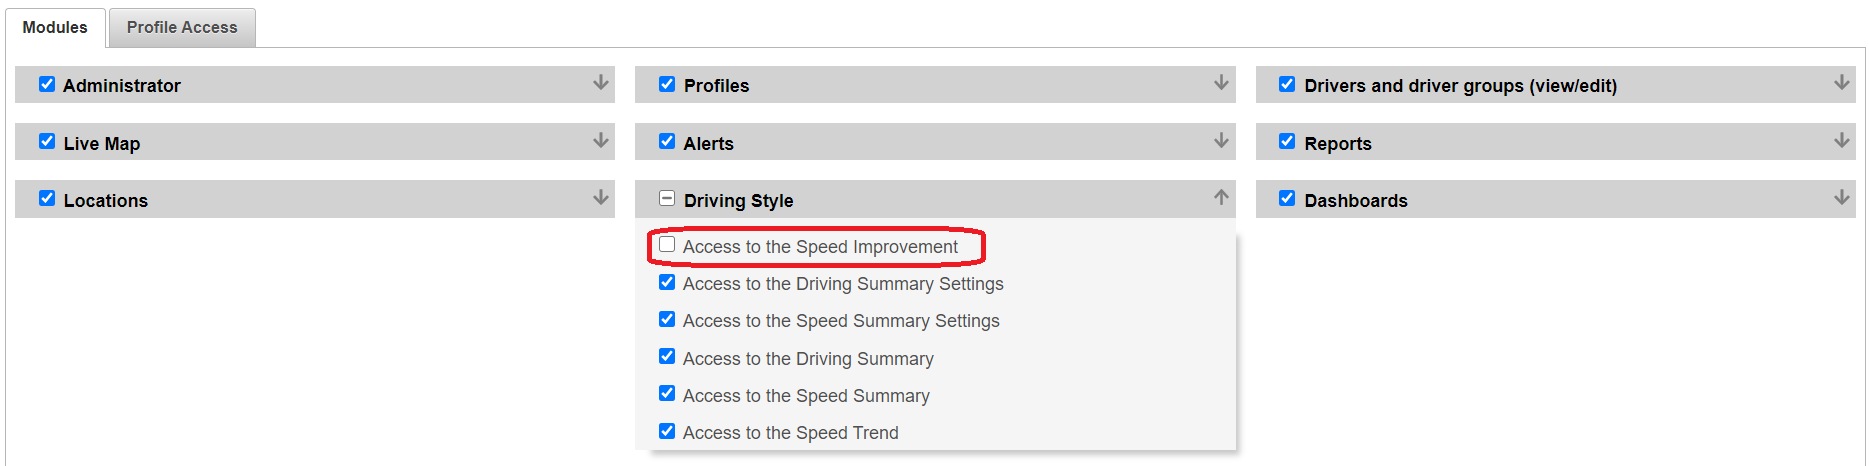
- You can disable it for particular users by creating a new profile with the report disabled.