If this feature is not available on your platform please contact support@transpoco.com
To open the report, either:
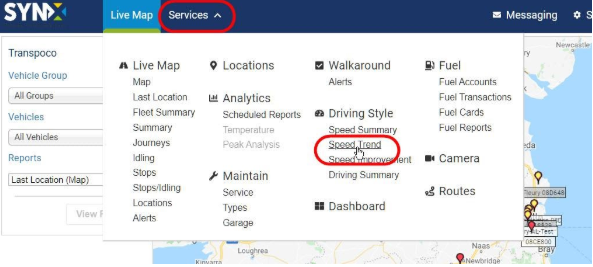
- From within Move, click on Services in the menu header.
- Click on Speed Trend under ‘Driving Style’ in the drop-down menu.
Or
- From within the Driving Module, click on Filter by vehicle under ‘Speed Trend’ in the Driving Style menu on the left-hand side.
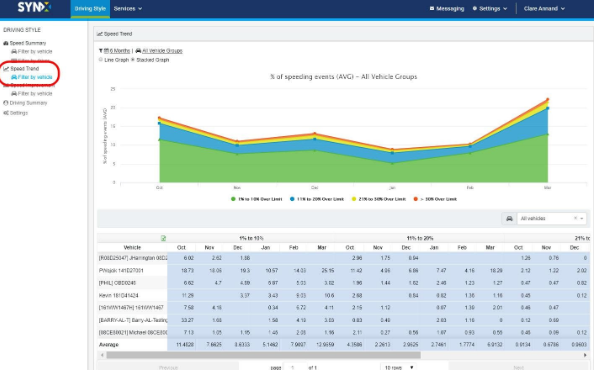
The information contained in this report covers the following for speeding trends during the selected period:
- Vehicle
- Total speeding events for each day/week for each % Over Speed range
- Average speeding events for each day/week for each % Over Speed range
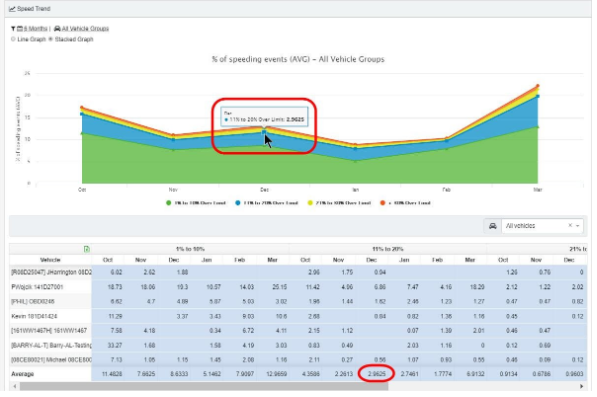
The numbers in the table are reflected in the chart – hover the cursor over the points to see the details.
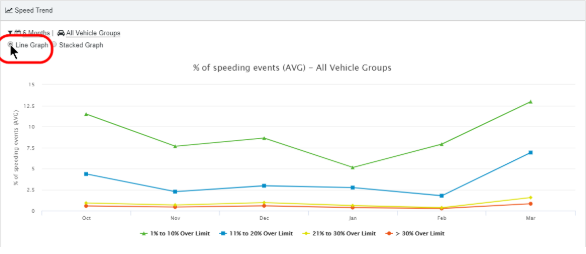
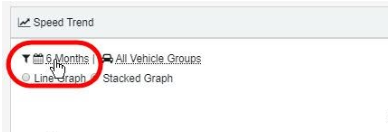
The default is a stacked graph, but you can change this to a line graph.
- Click on Line Graph above the chart.
The chart will automatically change to a line graph.
-
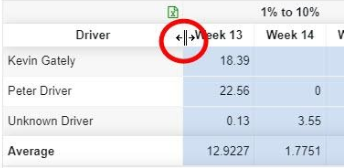
Resize table columns
- To change the width of one column, drag the boundary on the right side of the column heading until the column is the width that you want.
Note: you can only do this in the header row of the table.
-
Change the date range
- Click on the date range or calendar icon.
The filter options panel will open.
- Click on the required date period from the drop-down menu.
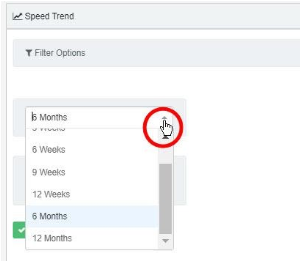
- Click on Apply Filter.
The table and chart will reload with data from the selected date period.
-
Filter by vehicle group
The default is to show all vehicle groups, but you can filter the results to show only one group.
- Click on All Vehicle Groups above the chart.
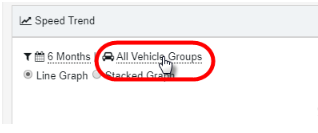
The filter option panel will open.
- Click on the required group from the drop-down list.
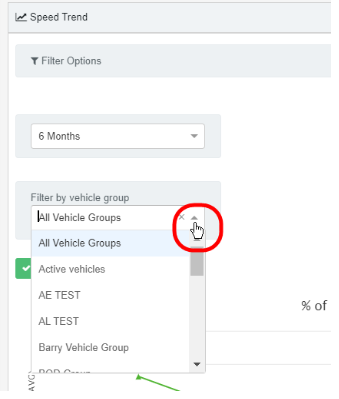
- Click on Apply Filter.
The chart and report will automatically filter to just show the selected vehicle group.
- If you wish to remove the group from the filter so all vehicles or drivers will be included, click on the small x next to the drop-down arrow.
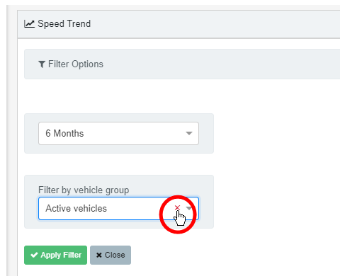
- Click on Apply Filter.
-
Export speed trend data
- To download the data as a CSV file, click on the Export icon above the table.
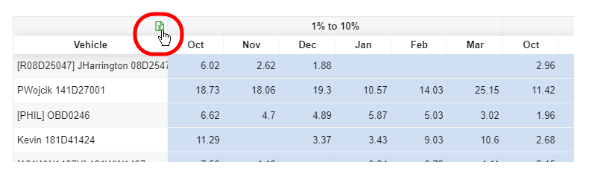
- Navigate to where on your system you want to save the file.
- Click on Save.