Speed Summary Report
The Speed Summary Report is populated from alerts set to trigger when the vehicle exceeds the set speed limit for the road by a certain percentage. (Note: alerts are covered in the SynX Move User Manual.)
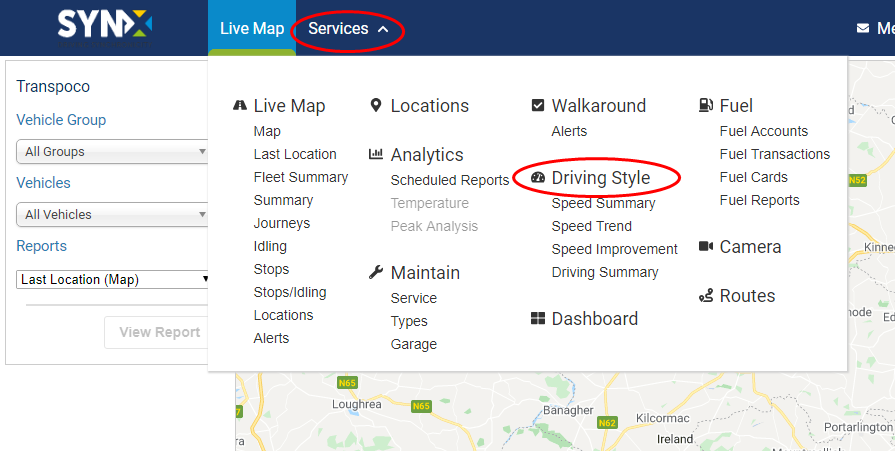
To open the report, either:
- From within Move, click on Services in the menu header.
- Click on Speed Summary under ‘Driving Style’ in the drop-down menu.
How to understand the Speed Summary
During a journey the Transpoco tracker in a vehicle can update an average every 15-20 seconds. Each update contains the speed and location of the vehicle.
Transpoco has an active database of road speed limits. We check the speed from each update against the speed limit of the road to identify speeding.
Let's use this Speed Summary from our demonstration account.
As we will explain below you can customise the time range and the vehicles included in the report. In this example, we selected the default time period which is the last 30 days and we will view data for all vehicles.
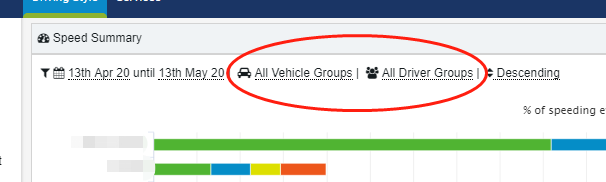
The vehicle with the description 'Nantes' is the worst vehicle for speeding. Around 14% of all updates from the tracker in the vehicle from the last 30 days indicated speeding over the road speed limit.

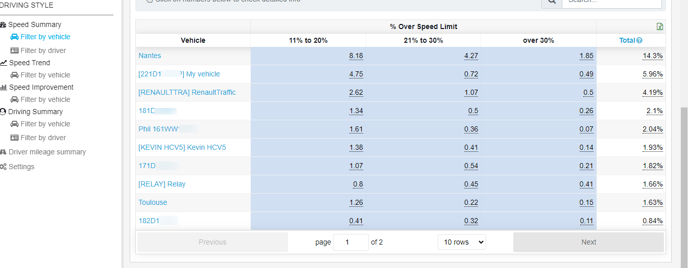
If you use our driver ID system in your vehicles then you will be able to view speeding by driver. Select the Filter by Driver option to view data by driver
Re-order the results
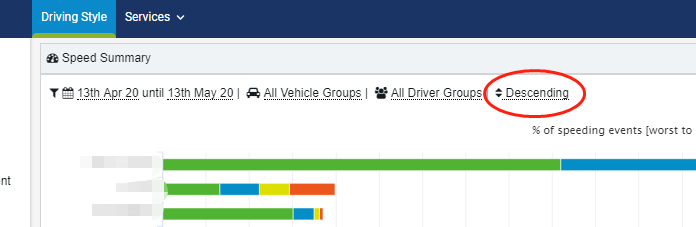
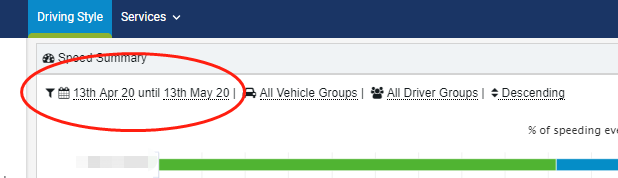
The results are show in descending order (default), which is worst to best.
- To change to ascending order, click on Descending. The filter options panel will open.
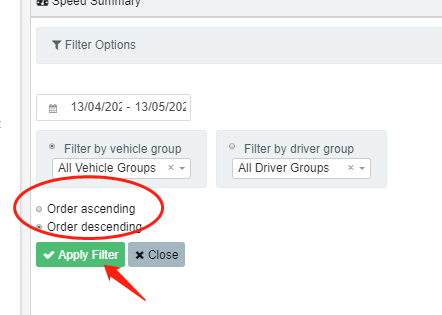
- Click on Order ascending.
- Click on Apply Filter.
Change the date range
You can select your own dates or select one of the preset date ranges.
- Click on the dates above the chart. The filter options panel will open.
- Click on the first date or the calendar icon to open the calendar and change the start of the required period.
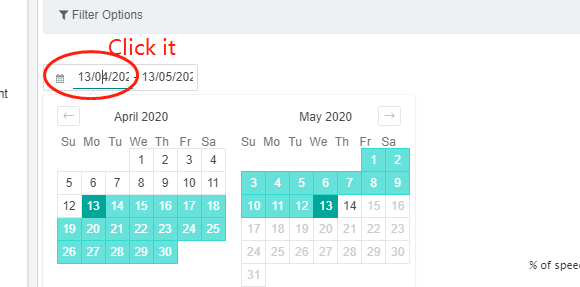
The calendar will open and the first date will be underlined in green so you know you are changing the start date.
Note: the current selected period is in green, with the start and end dates in darker green.
- If you want to choose your own dates, click on the required start date and the calendar will close.
Note: click on the previous and next arrows to view earlier or later months.
- Click on the second date to set the end of the required period.
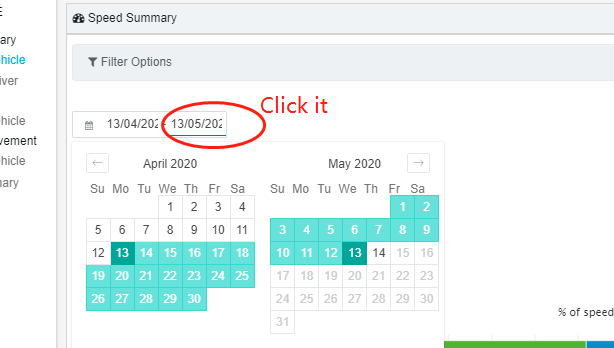
The calendar will open again and the second date will be underlined in green so you know you are changing the end date.
- Click on the required end date and the calendar will close. The new date range will be displayed.
- Alternatively, you can click on one of the set periods at the bottom of the calendar pop-up. This will automatically populate the date range.
- Click on Apply Filter.
Filter by vehicle or driver group
The default is to show all vehicle and driver groups, but you can filter the results to just show a single vehicle group or driver group.
- Click on either All Vehicle Groups or All Driver Groups. The filter options panel will open.
- Click on the required group from the drop-down list.
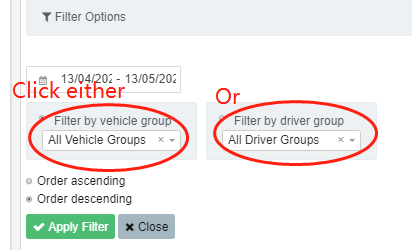
- If you wish to remove the group from the filter so all vehicles or drivers will be included, click on the small x next to the drop-down arrow.
- If you apply All Driver Groups filter, the page will change to Filter by driver page automatically, while the default page is Filter by vehicle.
- Click on Apply Filter, once you are ready.

Note: The report starts generating once the vehicle's engine is one if you choose All Vehicle Groups filter; the report only starts generating after drivers logged in to the system by using their unique fobs, if you choose All Driver Groups filter
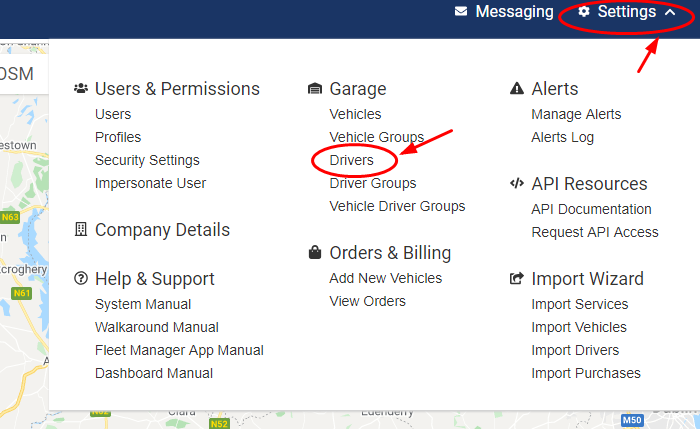
Assign unique fobs or vehicles to Drivers
- Click on Drivers in the Settings .
- Click on Edit to view and manage the detailed information of the driver.
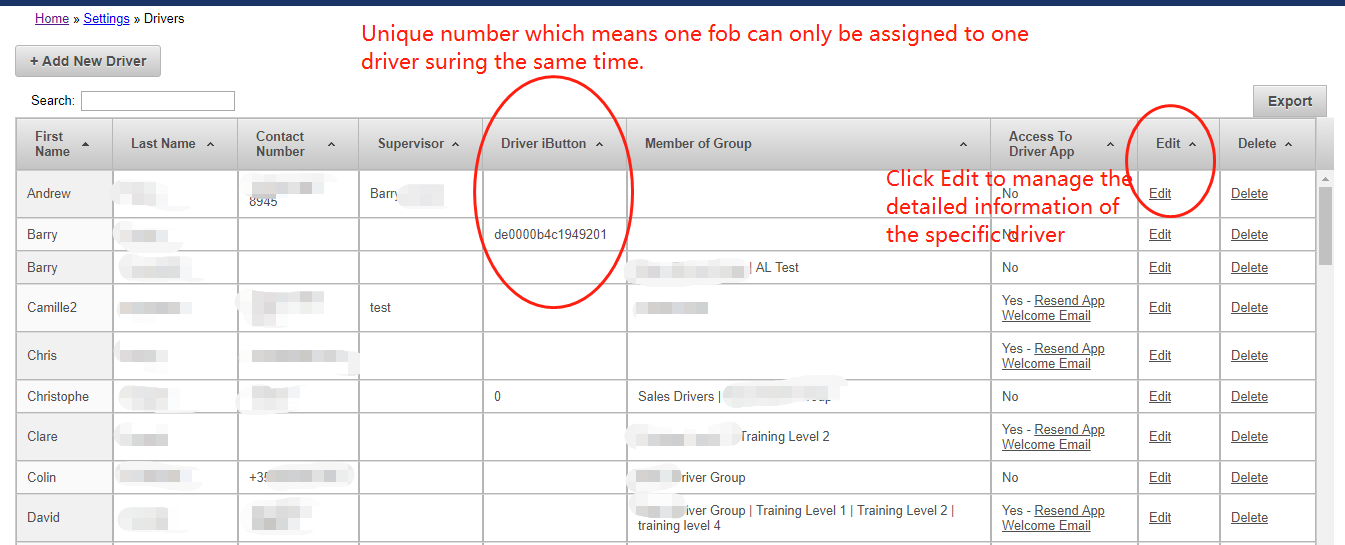
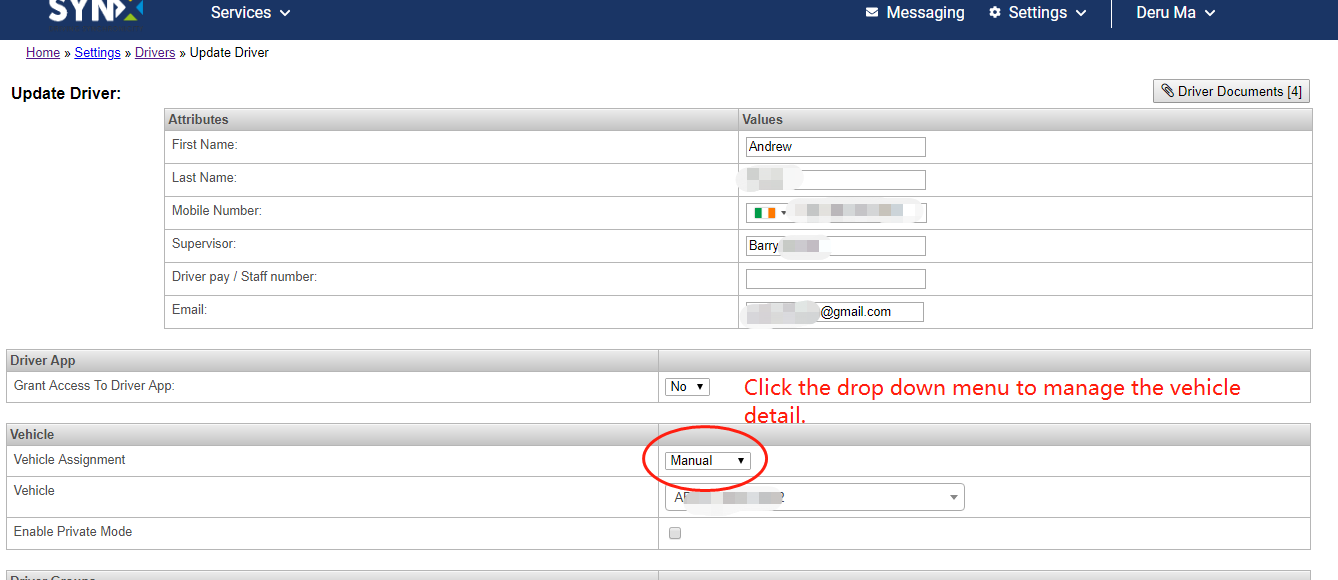
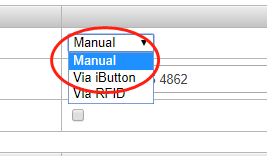
Note: You can add one of the vehicles on the list through Manual; You can also assign the fob to the driver by adding the IButton number through Via IButton.
-
Filter speed ranges
Each speeding range can be turned on or off in the chart.
- To hide a speeding range(s) from the chart, click on the relevant range(s) in the chart legend.
The chart will filter out that range automatically.
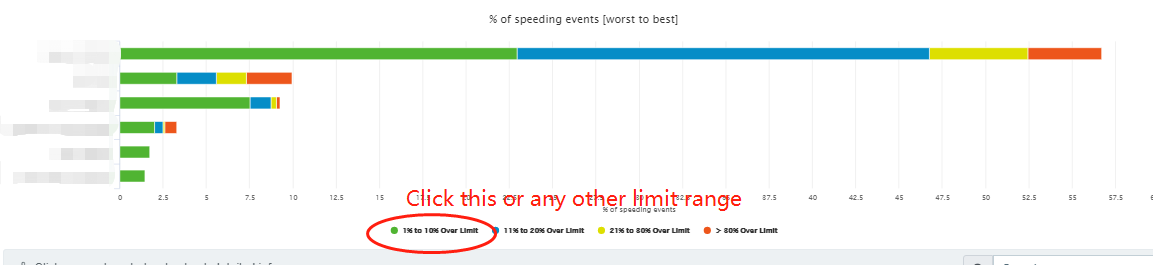
-
Click on the relevant range(s) to add them back to the chart.
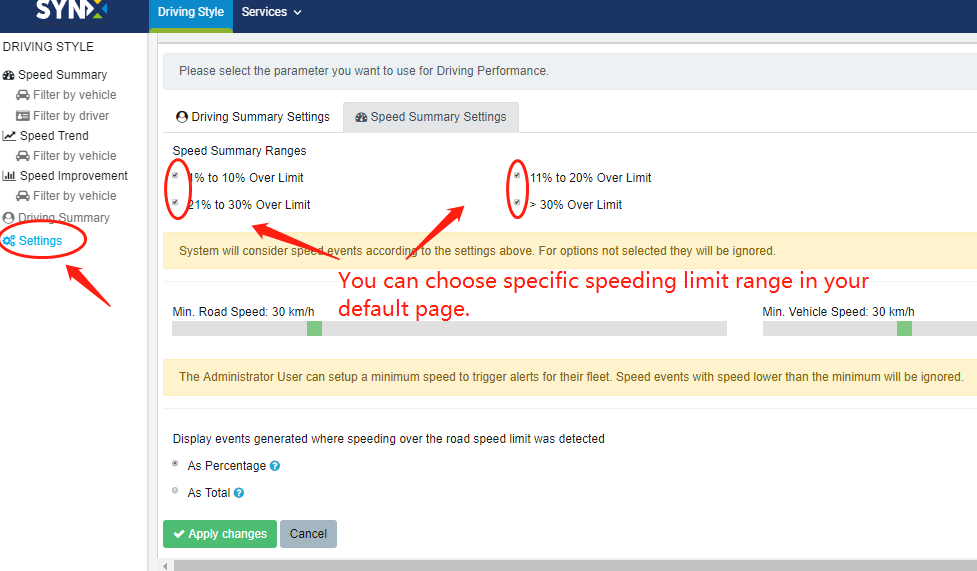
- You can set specific speeding limit range as your default page in Setting.
-
-
View the details of each occurrence within different speeding limit range
You can see details of each occurrence of a speeding range and their locations on the map.
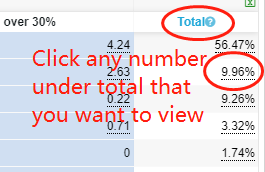
- Click on the number in the table.
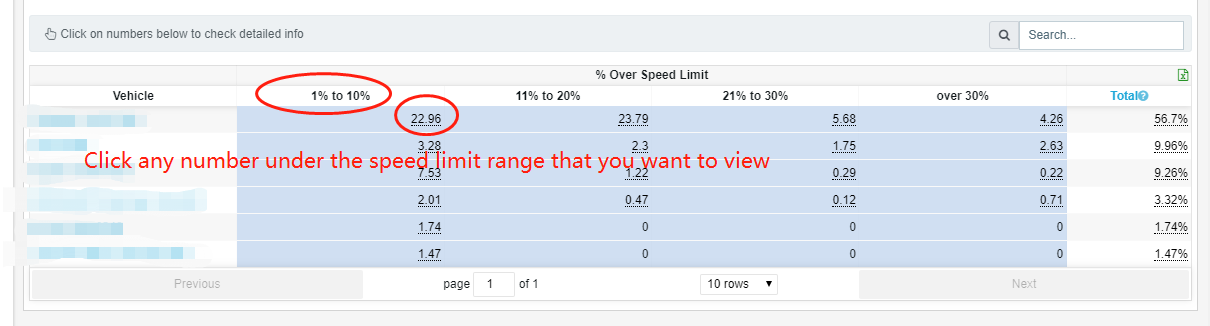
-
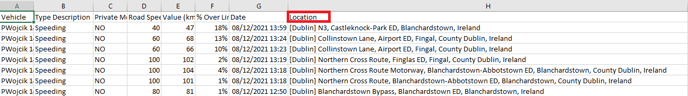
A table of all the speeding events incurred by that vehicle/driver in the selected % Over Speed Limit range will open, under a map showing the location on the first speeding event.
- The table includes: Vehicle; Driver;Type description; Location; Private mode; Road speed; Value; % Over limit; Date and Map.
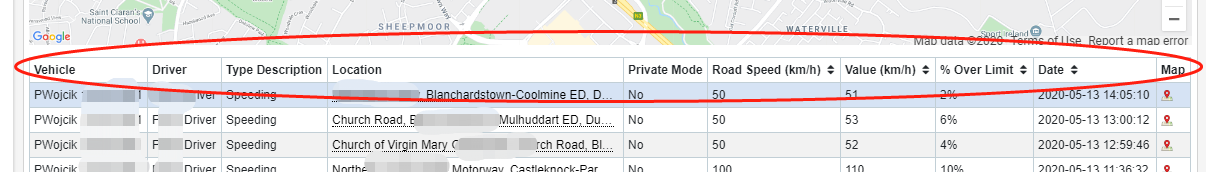
-
To see other locations, either click on the address or the map icon at the end of the row.
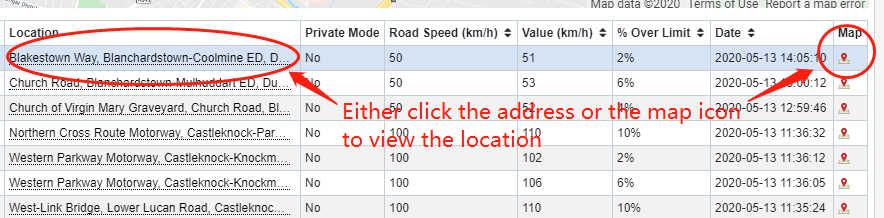
-
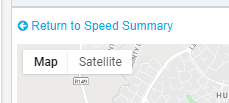
Use the Google map controls to zoom into the map or see in Street View using Pegman if required.
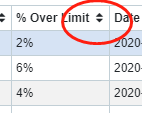
- Click the arrow once to sort into descending order (largest value first) of the Over Limit column; click again to re-sort into ascending order (smallest value first).
- To download the report, click on the "Download" button on the right above the map.
- To return to the main report, click on Return to Speed Summary above the map.
-
View all of a vehicle’s/driver’s speeding events
- To see details of all occurrences of all the speeding ranges and their locations on the map, click on the Vehicle/Driver name or the Total value in the table.
- As with viewing one speeding range, a table of all the speeding events incurred by that vehicle/driver in all % Over Speed Limit ranges will open under a map above showing the location of the first speeding event.
- Other functions remains the same as in the one speeding range report.