The Journey Report show all journeys made by each vehicle in a day. A journey is defined as engine turned on to engine turned off.
Note: If you require more detailed information about how to run the report, see How do I create a report?
- Select the Vehicle(s).
- Select ‘Journeys’ from the Reports drop-down list.
- Select the date range.
- Click on the View Report button.
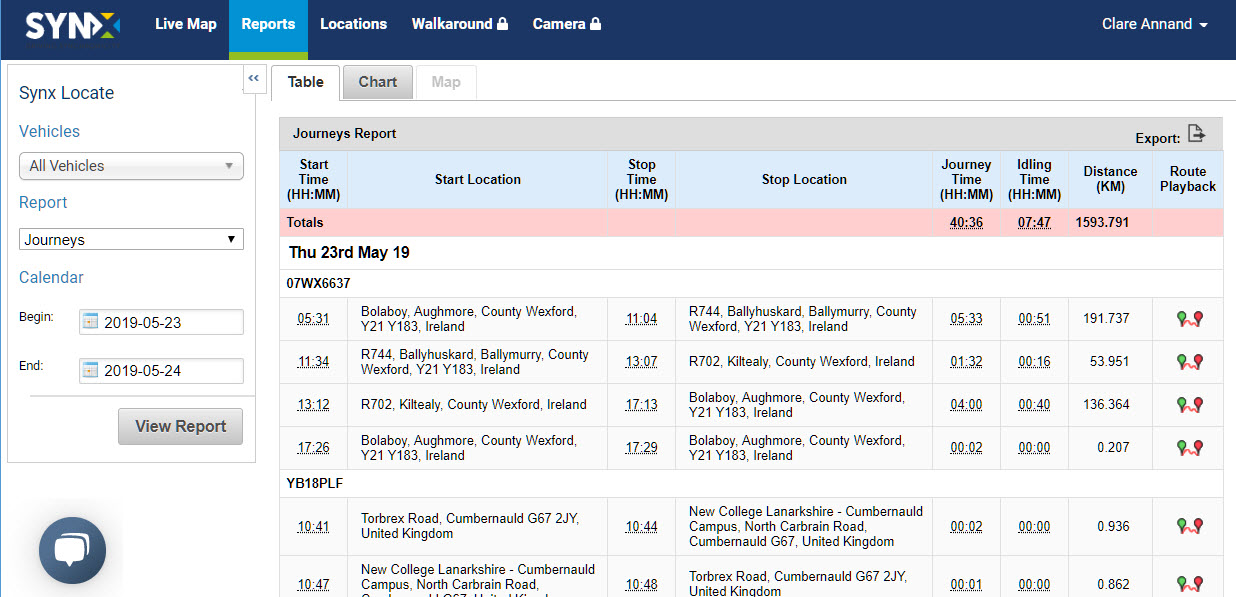
The totals for the fleet (or selected group of vehicles) are in the pink row.
The standard information contained in this report covers the following for each day during the selected period:
- Start Time: The time the journey started (engine on)
- Start Location: Where the journey started
- Stop Time: The time the journey started (engine off)
- Stop Location: Where the journey ended
- Journey Time: Length of time in hours & minutes that the engine was on
- Idling Time: Length of time the engine was on but vehicle did not move
- Distance: Distance (in km or miles) of journey
- Route Playback: Mapped route of the journey between start time and stop time
To export the data as .csv or .xls format, click on the Export icon above the far right column. For more information see How do I export a report?
View route
To view on the map a replay of the journey of any vehicle on any day, click the Route Playback icon at the end of that row.
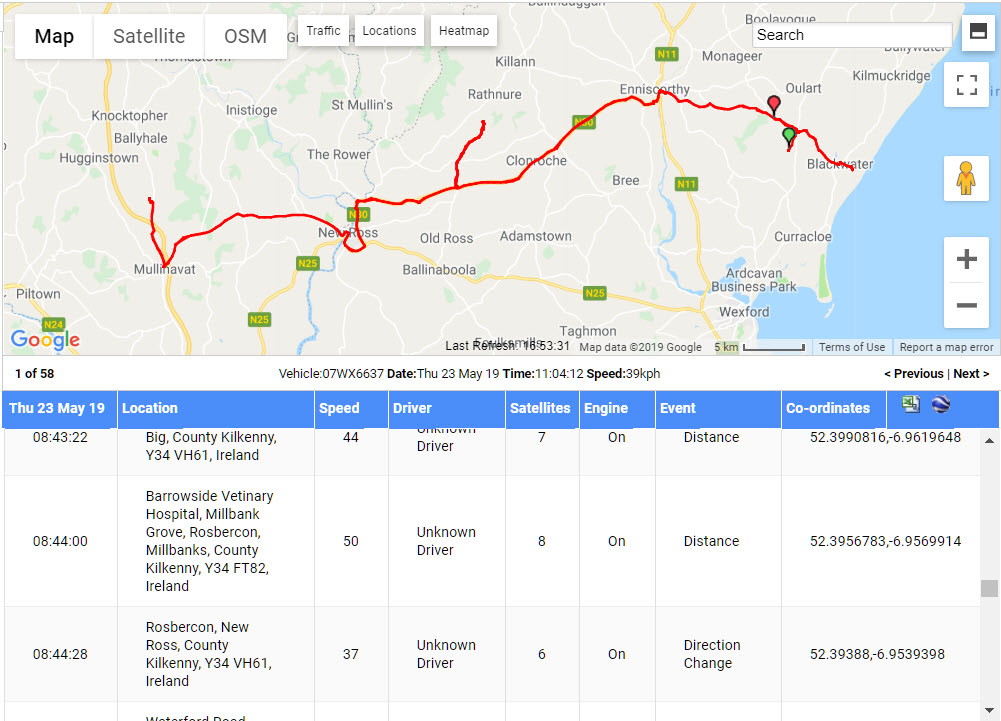
The journey is mapped from start (green pin) to finish (red pin).
The rows show the individual driving events and driving time intervals (usually every ~30 seconds) that sent data from the GPS unit to the software.
The standard information contained in this table covers the following for each driving event and part of the journey:
- Date: Shows the date of the journey
- Location: Where the driving event took place
- Speed: Snapshot of the speed when driving data was sent
- Driver: Assigned driver to vehicle
- Satellites: Number of satellites tracking the vehicle GPS
- Engine: Ignition on or off
- Event: Vehicle data updates on movement and time intervals
- Coordinates: Map coordinates of location
Click on rows in the table to view the corresponding event on the journey as black arrows.
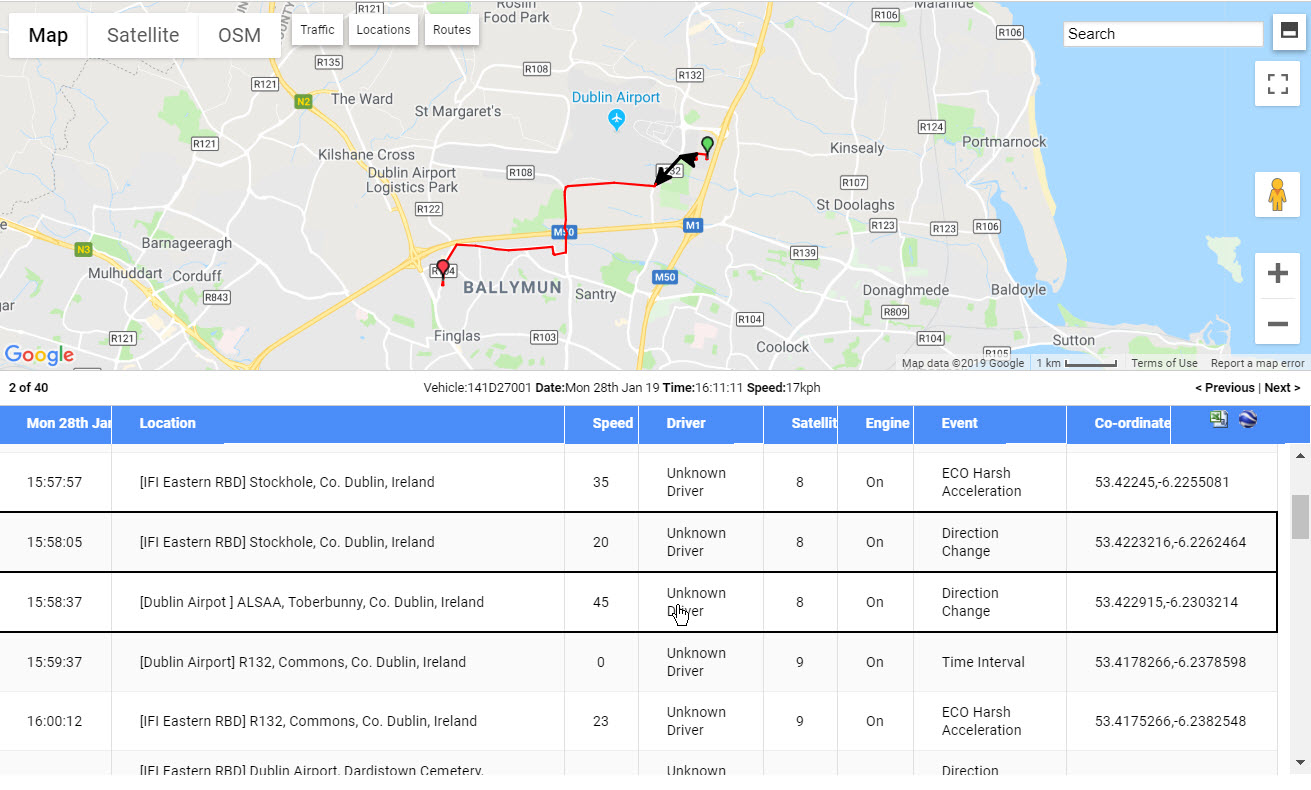
Use the map controls to zoom into parts of the journey or view in Street View.
By default, the map and table are split 50/50 on the screen. To show the map full screen, click on the Split Screen icon (top icon) in the top left-hand corner. The system will remember your choice.
As the map will fill now the screen, scroll down to view the table rows.
Click the icon again to return to 50/50 split screen.
To view only the map in full screen, click on the Full Screen icon (bottom icon) in the top left-hand corner.
To exit the full screen mode, click on the icon again or press the ESC key on your keyboard.
To export the data as .csv or .xls format, click on the Export icon above the far right column. For more information see How do I export a report?
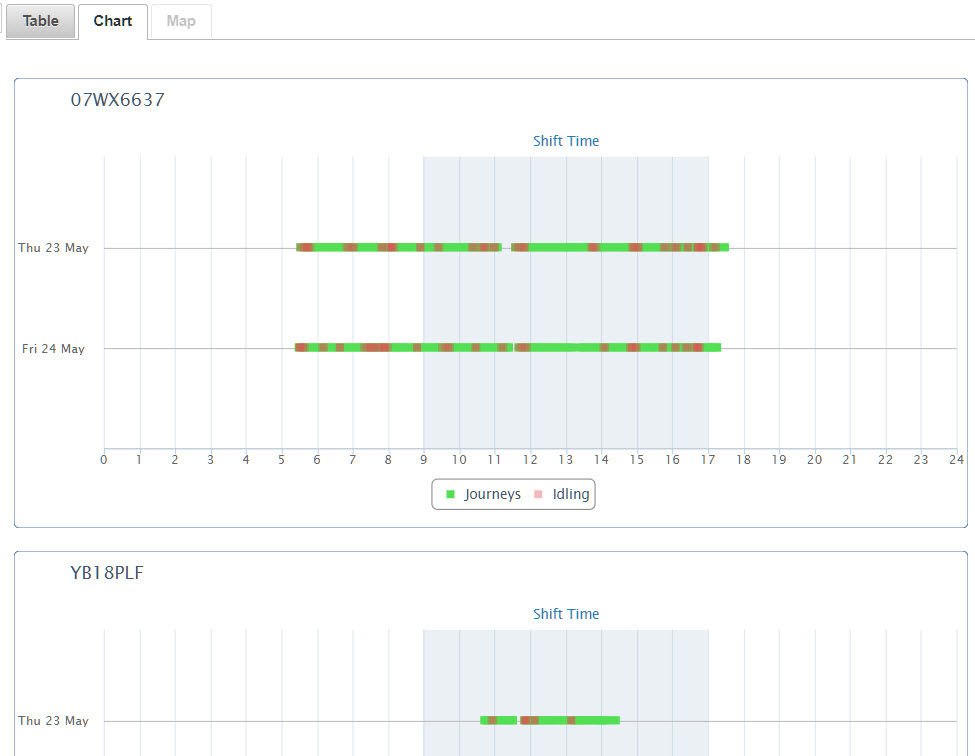
Chart view
The Journey chart view graphs the Travel Time and Idling Time per vehicle per day.
From the main tabular report, click on the Chart tab.