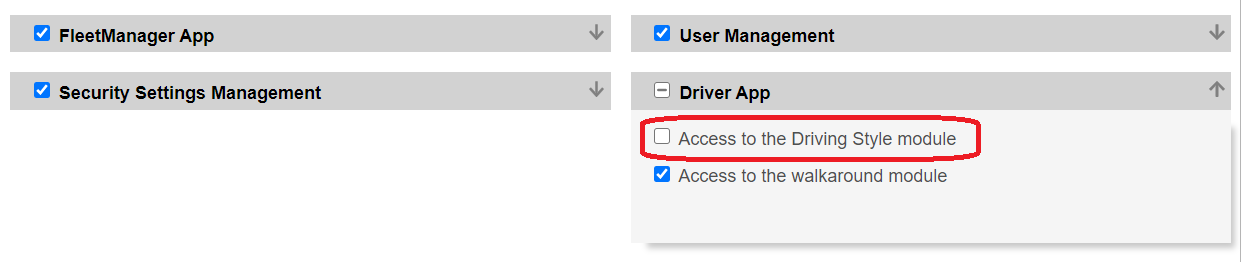
Apart from submitting walkaround checklists, a driver can view their personal driving style data in the Driver App. We can enable the Driving Style section in the Driver App.
Note: The Driving Style section in the Driver app will be enabled based on a request from the customer, it is not a default feature. There is no extra cost to enable the Driving Style section in the app. Contact support@transpoco.com if you want to learn more.
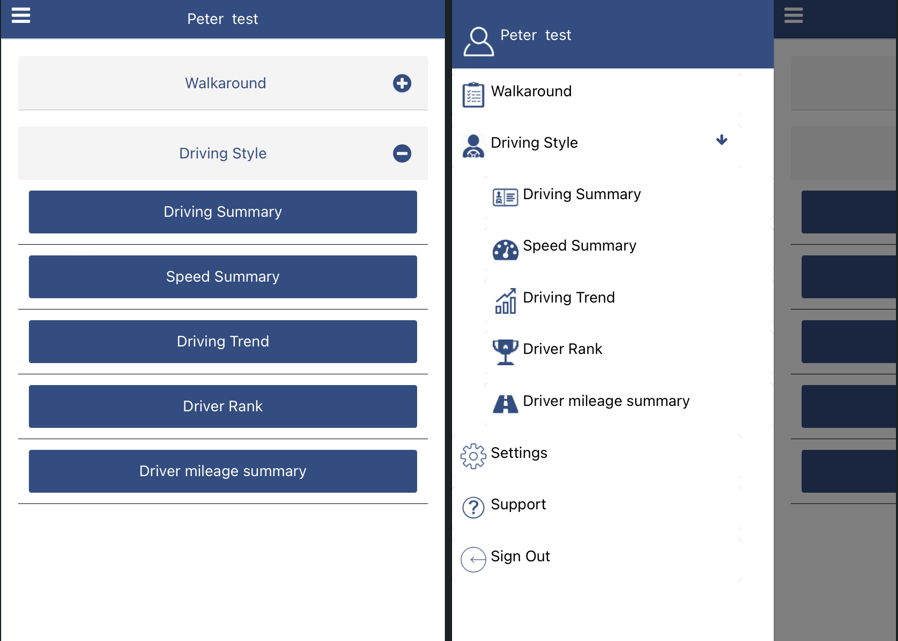
After the Driving Style section has been enabled it will appear on home screen and on the side menu - see the screenshots below.

Click on the Driving Style option to reveal the 5 reports available.

1. Driving Summary
Your Drivers will be able to check their Speeding, Harsh Braking, Rapid Acceleration and Harsh Cornering percentages as the calculation is based on how much they drive. Also, they can find their score which will be used for the Rank in a near future.
Note: Administrators can change the weightings/sensitivity attached to each type of event. Go to the Settings section of the Driving Style section in your Transpoco account.
The Driving Summary opens to show driving events for the current week (default).

The default driving summary displays the following:
- Speeding %: Percentage of events of speeding over the speed limit
- Harsh Braking: Events per 100km
- Rapid Acceleration: Events per 100km
- Harsh Cornering: Events per 100km
(Score %: Calculated from driving events and their weightings)
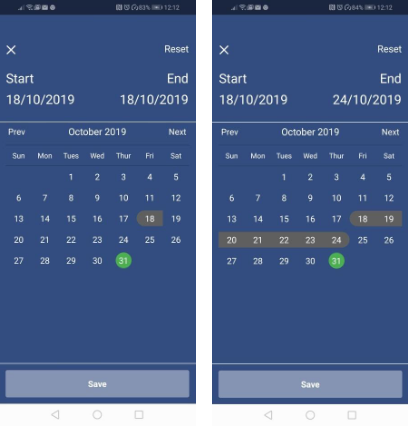
To change the date period, tap on the date.
Tap on a date to set the start date.
Tap on a second date to set the end date.
Notes
If you're using AI forward facing and driver facing cameras, it might also display some or all of the following events:
- Distracted Driver: Events per 100km
- Driver Making Calls: Events per 100km
- Fatigue Driving: Events per 100km
- Driver Smoking: Events per 100km
- Driver Yawning: Events per 100km
- Forward Collision: Events per 100km
- Too Close Distance: Events per 100km
Administrators can choose which events to show in the Driving Summary. Go to Settings in the Driving Style section in the Transpoco account.

Note: The green highlighted date denotes the current day.
PS: As the Fleet Manager, you are the one that can define the type of events you want to display and use in Score calculation inside the Settings section in the web module.
2. Speed Summary
Your Drivers will be able to check their Speeding regarding the percentage over Speed Limit. Fleet Managers also can define what percentages they want to be displayed in the Settings section of the web module.
Note: Fleet Managers can define what percentages are to be displayed in the Settings section in the Driving Style module.
- From either the home page or the drop-down menu, tap on Driving Style.
- Tap on Speed Summary.
The Speed Summary opens to show speeding events for the current week (default).

The default speed summary displays the following:
- Total: Percentage of events of speeding over all speed limits
- 1% to 10% Over Limit: Percentage of speeding events 1-10% over the speed limit
- 11% to 20% Over Limit: Percentage of speeding events 11-20% over the speed limit
- 21% to 30% Over Limit: Percentage of speeding events 21-30% over the speed limit
- >30% Over Limit: Percentage of speeding events greater than 30% over the
speed limit
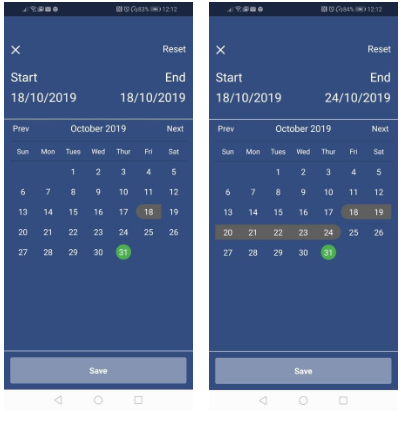
- To change the date period, tap on the date.
- Tap on a date to set the start date.
- Tap on a second date to set the end date.
Note: the green highlighted date denotes the current day.
3. Driving Trend
Your Drivers will be able to check their score for the past weeks in a trend graphic which will help them improve their safety each week.
You can check your scores in a trend graphic to help you improve your driving behaviour.
- From either the home page or the drop-down menu, tap on Driving Style.
- Tap on Driving Trend.
The Driving Trend opens to show total scores calculated from driving events and their weightings for the last 7 days (default interval).
Note: Scroll down the list to see all the days and scores.

- To see the breakdown of driving events and their scores, tap on the date in the table.

- To change the interval, tap on Last seven days (or other interval) at the top of the screen.
- Tap on the required interval.

The following images show a 3-week interval and a 12-week interval as examples. As can be seen, over the last three weeks the driver has increased their bad driving events.

- To see the breakdown of driving events and their scores, tap on the week in the table.
P.S.: The data started to be collected 7 days ago, so you should search for data from the last 7 days only. It is now collecting data so the gap will disappear.
4. Driver Rank
Drivers Rank is based on your drivers’ score from the day before which means the Rank can change on a daily basis. At the moment, you can follow it from the Driving Summary which is ordered by score as well. You just need to change the calendar filter to reflect data from the desired day.
Driver Rank is based on each driver’s score from the previous day so the Rank can change on a daily basis.
- From either the home page or the drop-down menu, tap on Driving Style.
- Tap on Driver Rank.

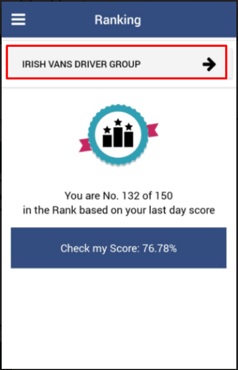
The Driver Rank opens to display your position compared with other drivers in the fleet / driver group selected.
Note: As a driver, you will only see the Driver Groups set for your account.
- Note: You can also disable it for particular drivers by checking out the Driving Style option in their profile.
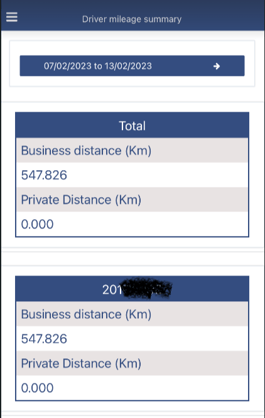
5. Driver Mileage
Driver Mileage displays the 'Total business distance' driven and the 'Total private distance' driven in KM or MI depending on the user preferences.
- From either the home page or the drop-down menu, tap on Driving Style.
- Tap on Driver Mileage Summary.
- Then, select the period you wish.

-
Offline Mode
If there is no internet connection, the checklist is saved for future sending.
