- Log in to your Transpoco account.
- Click on the Services > Dashboard.

Note: Each metric has the same operations available which are:
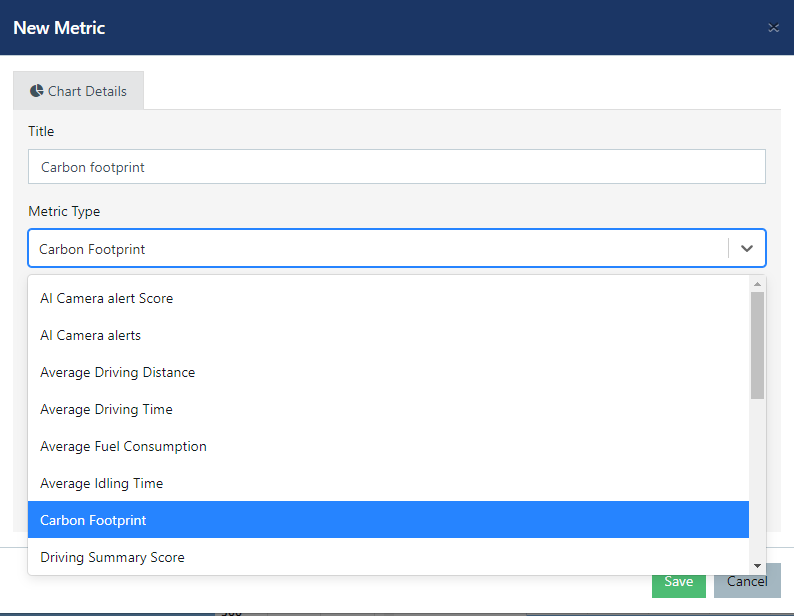
a. Create a preferred title and choose the metric type.

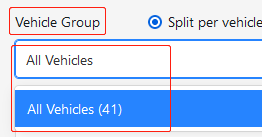
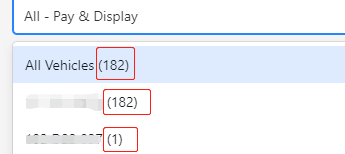
You can view the total number of vehicles in each group between brackets beside the group.


or select your customized period.


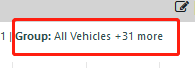
Note: You can also view the total number of groups selected in each widget from your Dashboard.
You can also view this article, to learn how to create a new metric.
3. There are 19 metrics in total:
Percentage of Checks with Defect;
Percentage of journeys Driver ID used;
Percentage of vehicles Driven with check;
Percentage of vehicles Driven without check;
- AI Camera alert Score:
This metric demonstrates the Driver Behaviour Compliance Percentage for the selected vehicles/vehicle groups during the selected time period.
Note: All vehicles with cameras will start at 100% compliance. Once they start to receive the alerts then it will cause a reduction in the Camera Alert Score percentage.


Note: If you want to view drivers’ performance on camera alerts separately, please select one alert per metric.
For more details please view this article.
- AI Camera alerts:
This metric demonstrates the total number of camera alerts for the selected vehicles/ vehicle groups during the selected time period.


Note: If you want to view drivers’ performance on camera alerts separately, please select one alert per metric, then create five separate metrics in the dashboard.
For more details please view this article.
- Average Driving Distance:
This metric demonstrates the average driving distance in KM or MI (according to the user preference) for the selected vehicles/ vehicle groups during the selected time period.

- Average Fuel Consumption:
This metric demonstrates the average fuel consumption (L/KM or MPG) for selected vehicles/vehicle groups during the selected time period.
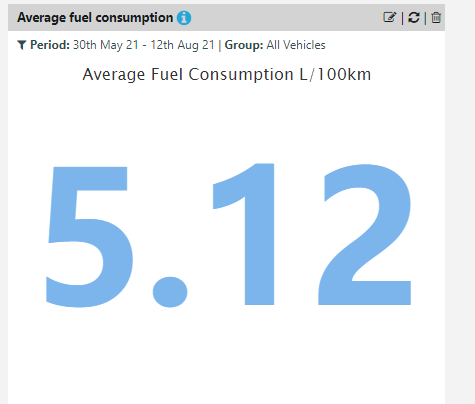
Note: For more details please view this article or this article.
- Average Idling Time:
This metric demonstrates the Average Idling Time for selected vehicles/vehicle groups during the selected time period.

- Average Driving Time:
This metric demonstrates the Average Driving Time for selected vehicles/vehicle groups during the selected time period.

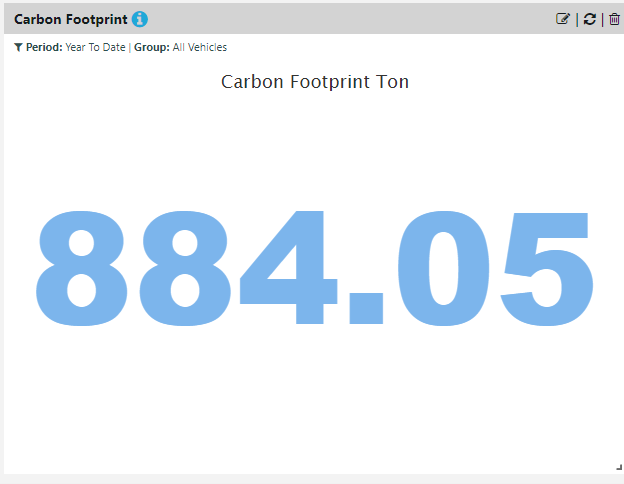
- Carbon footprint
This metric demonstrates the emission of Carbon Footprint in tonnes for selected vehicles/vehicles groups during a selected time period.
You can select the split per vehicle option:
-png.png)
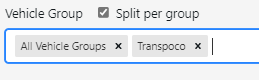
You can also select split per group:
- Driving Summary Score:
This metric demonstrates the driving score for the selected vehicles/ vehicle groups during the selected time period. This score takes into consideration the same settings from the Driving Style module. Possible driver score parameters are:
- Rapid Acceleration
- Harsh Braking
- Harsh Cornering
- Speeding
Note: All vehicles will start at 100% compliance. Once they start to receive the alerts then it will cause a reduction in the Driving Score percentage.

Note: For more details please view this article.
- Fuel Consumption:
This metric demonstrates the fuel consumption (L/KM or MPG) for the selected vehicles/ vehicle groups during the selected time period.

- Percentage of Checks with Defect:
This metric demonstrates the percentage of checks done (WalkAround checks) with defects reported for the selected vehicles/ vehicle groups during the selected time period.

- Percentage of journeys Driver ID used:
This metric demonstrates the percentage of journeys with driver ID used for the selected vehicles/ vehicle groups during the selected time period.

You can also filter out small journeys which usually don't have a driver Id logged as they are often run in a garage for example. e.g.: select the operator "Greater than" and add 3 to the value. This means the metric will filter out all journeys under 3 km and take into account only journeys over 3 km. This will help you with your compliance percentage.
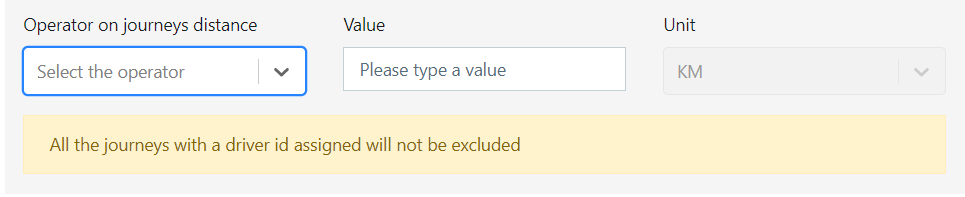
Note: All the journeys with a driver id assigned will not be excluded even if matching with the criteria selected. The objective is to exclude only journeys with NO driver Id based on the criteria selected.
For more details, please view this article.
- Percentage of vehicles Driven with check:
This metric demonstrates the percentage of vehicles driven with check (WalkAround check done BEFORE the vehicle is driven) for the selected vehicles/ vehicle groups during the selected time period.

- Percentage of vehicles Driven without check:
This metric demonstrates the percentage of vehicles driven without check (Walkaround check done BEFORE the vehicle is driven) for the selected vehicles/ vehicle groups during the selected time period.

- Speed Summary:
This metric demonstrates the speed alerts summary (when the speed is over the road speed limit) for the selected vehicles/ vehicle groups during the selected time period.

Note: You can choose to show different ranges by changing the settings in Services > Driving Style.
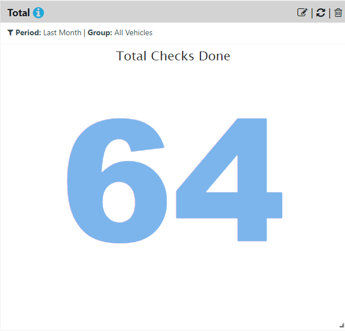
- Total Checks Done:
This metric demonstrates the number of checklists submitted by drivers during the period selected.
- Total Days not Driving:
This metric demonstrates the total number of days not driving for the selected vehicles/ vehicle groups during the selected time period.

- Total Days Driving:
This metric demonstrates the total number of days driving for the selected vehicles/ vehicle groups during the selected time period.

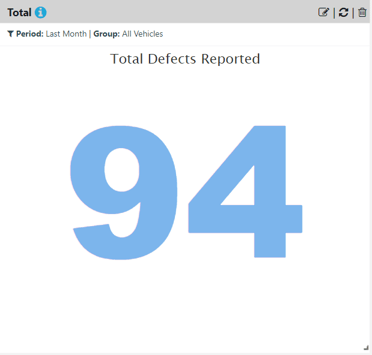
- Total Defects Reported:
This metric demonstrates the number of defects reported by drivers during the period selected.
- Total Driving Distance:
This metric demonstrates the total driving distance in KM or MI for the selected vehicles/ vehicle groups during the selected time period.

- Total Idling Time:
This metric demonstrates the total idling time in HH:MM (Hours:Minutes) for the selected vehicles/ vehicle groups during the selected time period.

- Total time Driving:
This metric demonstrates the total time driving in HH:MM (Hours:Minutes) for the selected vehicles/ vehicle groups during the selected time period.

- Utilisation:
This metric demonstrates the utilisation in percentage for the selected vehicles/ vehicle groups during the selected time period. You will get two numbers, one is the average utilisation of active vehicles, another is the average utilisation of all fleet.
