The Locations Report allows for analysis of any given location or area (geofence) stored in the Locations Database; for instance, what activity occurred at a site or within an area for the last week.
For instructions on how to create locations and geofences to store in the Locations Database, see How do I add a location or geofence?
Note: If you require more detailed information about how to run the report, see How do I create a report?
- Select the Vehicle(s).
- Select ‘Locations’ from the Reports drop-down list.
- Select the location or geofence from the Locations drop-down list.
- Select the date
- Click on the View Report
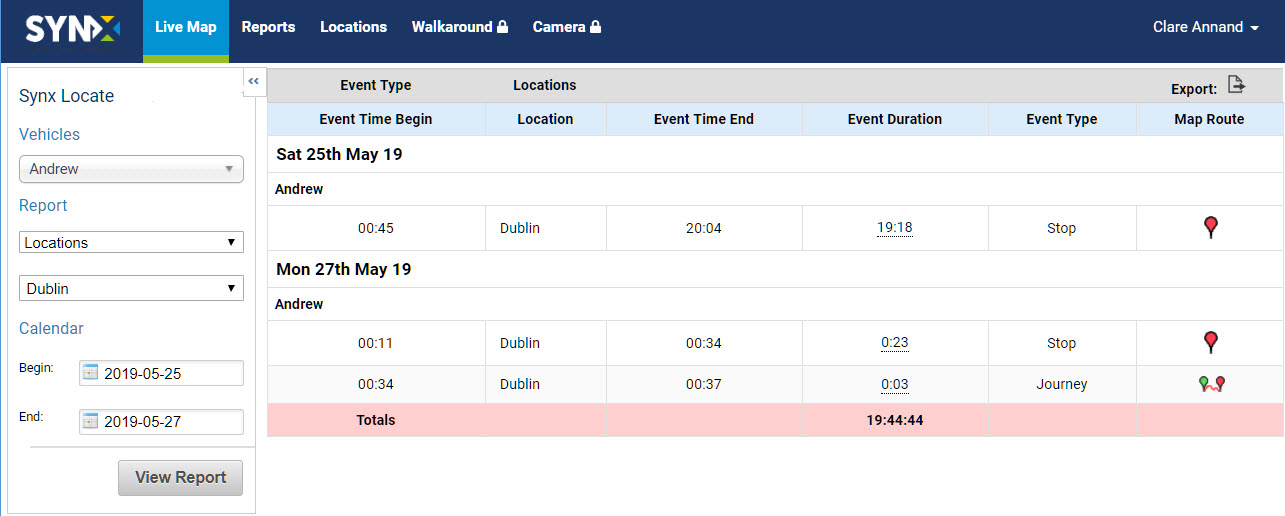
The total time spent at the location or within the geofence for the fleet (or selected group of vehicles) is in the pink row.
The standard information contained in this report covers the following for each day during the selected period:
- Event Time Begin: The time the vehicle entered the boundary of the location
- Location: Where the event happened
- Event Time End: The time the vehicle left the boundary of the location
- Event Duration: Length of time (in hours & minutes) vehicle was within location
- Event Type: Vehicle passing through on journey or stopped within location
- Map Route: Route of the journey or exact location of stop shown on map
- To export the data as .csv or .xls format, click on the Export icon above the far right column. For more information, see How do I export a report?
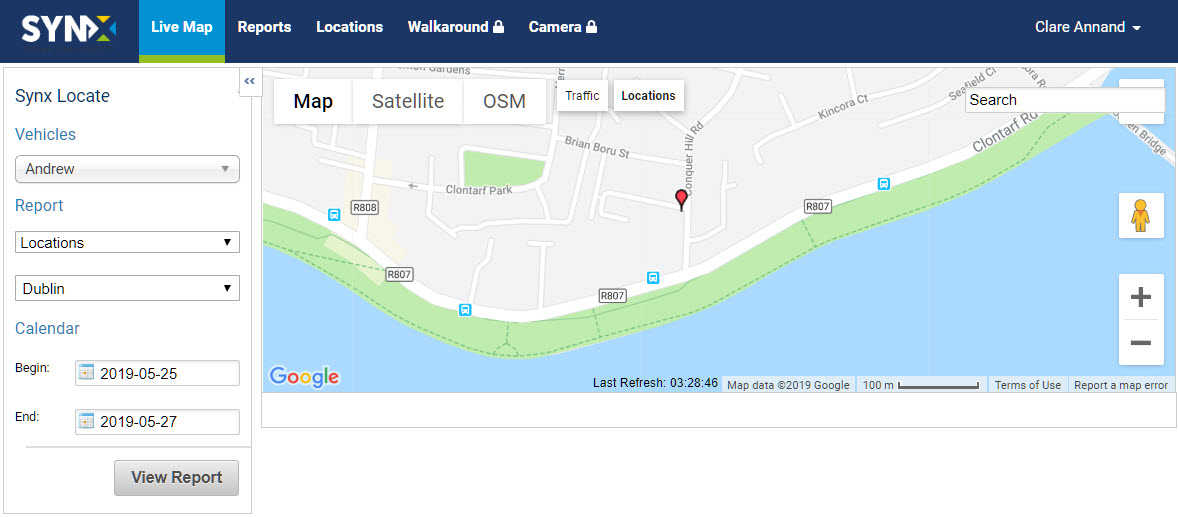
View route or stop
To view on the map a stop or a replay of the journey of a vehicle within the location, click the Map Route icon or red pin Stop icon at the end of the row in the table.
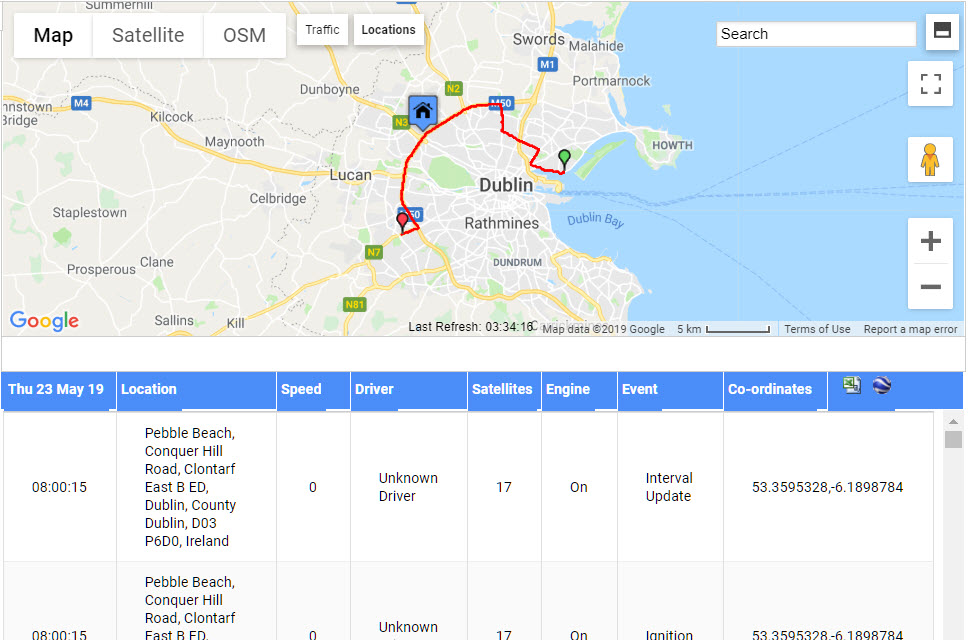
The route travelled inside the location boundary (as defined in SynX Locate) is shown as starting at the green pin and ending at the red pin, which also therefore shows the direction the vehicle was travelling in.
- By default, the map and table are split 50/50 on the screen. To show the map full screen, click on the Split Screen icon (top icon) in the top left-hand corner. The system will remember your choice.
- As the map will fill now the screen, scroll down to view the table rows.
- Click the icon again to return to 50/50 split screen.
To view only the map in full screen, click on the Full Screen icon (bottom icon) in the top left-hand corner.
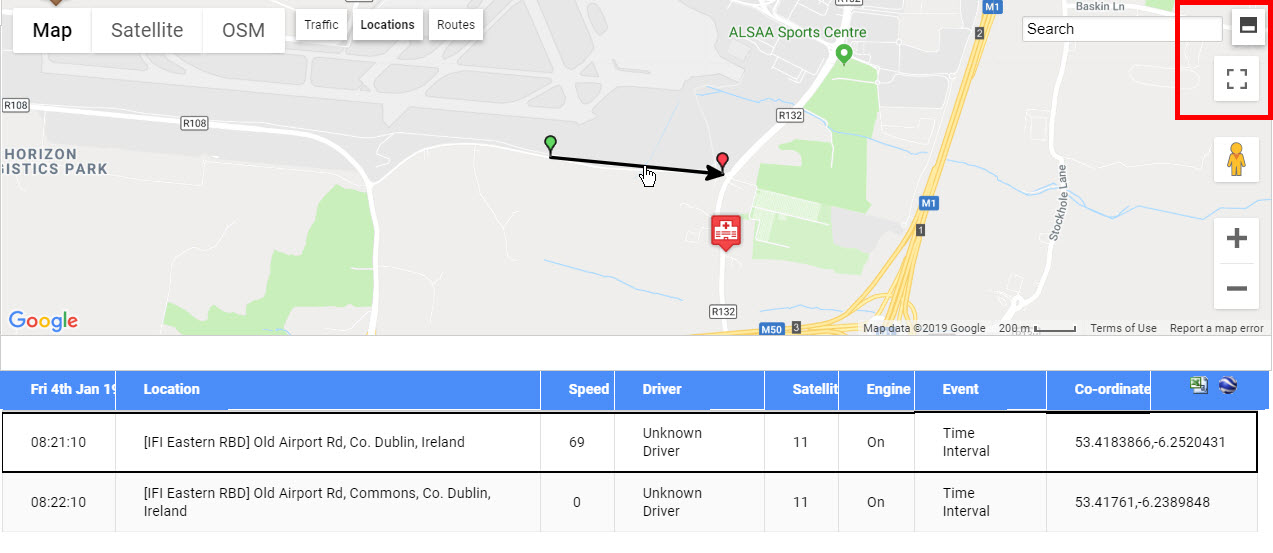
To exit the full screen mode, click on the icon again or press the ESC key.
Hover the cursor over the route and the red line will become a black arrow to show the direction of travel, and the corresponding event will be highlighted in the rows.
To return to the table view from the map view, either re-click on Reports in the navigation menu at the top or click on the View Report button.
To export this detailed data in .csv format, click on the Excel icon in the top right-hand corner of the table.
To save the report to Google Earth in .kml format, click the Google Earth icon next to the Excel icon. Saved places can be imported into Google Earth on the device on which you saved them.